APPLICATIONS · FLEET MAINTENANCE
The opposite mistake is quieter: vehicles drained on the odometer while the oil was still fit for work, money poured away year after year. Both come from one habit — guessing the moment with a mile counter instead of evidence. Oil is that evidence. This guide walks through fleet maintenance oil analysis in three steps: sampling, reading, deciding.
What Is Fleet Maintenance Oil Analysis?
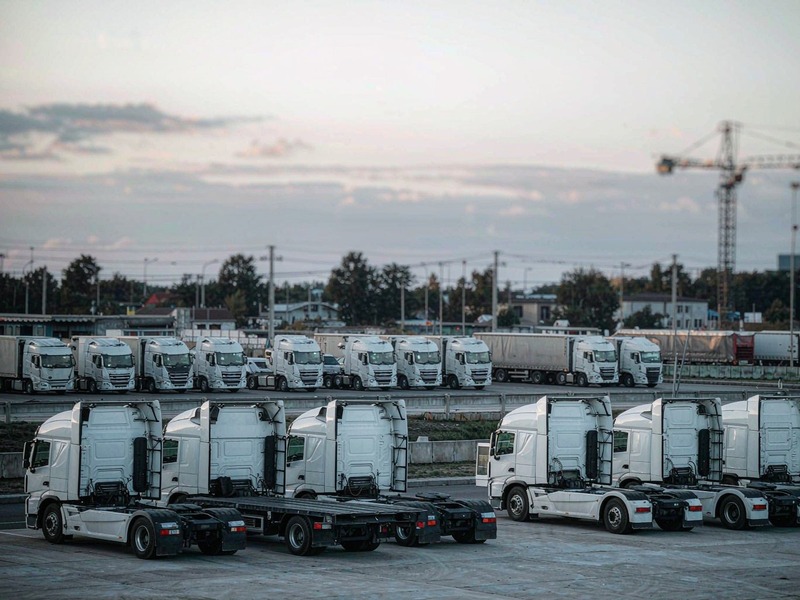
One yard, many duty cycles: no single drain date fits every vehicle.
You draw a small bottle of oil from a fixed point on a working vehicle, measure its elements, its particles and its fluid properties, and let the numbers say whether that vehicle can keep running and whether the oil deserves to stay in.
It does not settle vague questions about oil quality. It answers three things you can act on: how far wear has gone, what has entered from outside, and how much service life is left. Put one vehicle's results in order and a single test becomes a curve you can read.
Types of Fleet Maintenance
Most fleets run a blend of three strategies, and the blend is what shapes the whole maintenance programme.
Preventive maintenance books work against the calendar, the odometer or engine hours. It is the backbone of most programmes because it is easy to budget and staff. Its weakness sits in the same place: the schedule is blind to the vehicle, and two identical tractors on different routes wear at different speeds.
Corrective maintenance deals with what has already gone wrong — a defect picked up at an inspection and fixed at the next planned stop, or a breakdown on the road. Unplanned corrections are the costly kind: recovery, overtime and a vehicle out of service when it is needed most. No fleet runs without them, so the practical aim is to keep pushing them into planned windows.
Predictive maintenance works the other way round: it reads condition data and books work while the component is still serviceable. Oil analysis is one of its main inputs, and it is the strategy the rest of this guide feeds.
Fleet Maintenance Intervals
An interval is simply how often a job gets done. Three things set it: the calendar, the distance covered, and what the test results say.
Calendar-based work happens on a date, whether the vehicle moved or not. Seals, coolant and brake fluid age while a truck sits, so time is the right trigger here.
Distance-based work follows the odometer or the hour meter — how far it has run, or how long. Wear parts that track distance belong in this group.
Condition-based work waits for a number to move: the job is booked when a reading crosses its line. On lubricated circuits, oil analysis is the reading that fires it.
For a mixed fleet, start from the manufacturer's schedule and let each vehicle's own data shift the date. A town delivery van and a long-haul tractor rarely need fresh oil at the same point; one fixed interval for both means one is changed too early and the other runs too long.
▍How the Instruments Work Together for Fleet Maintenance
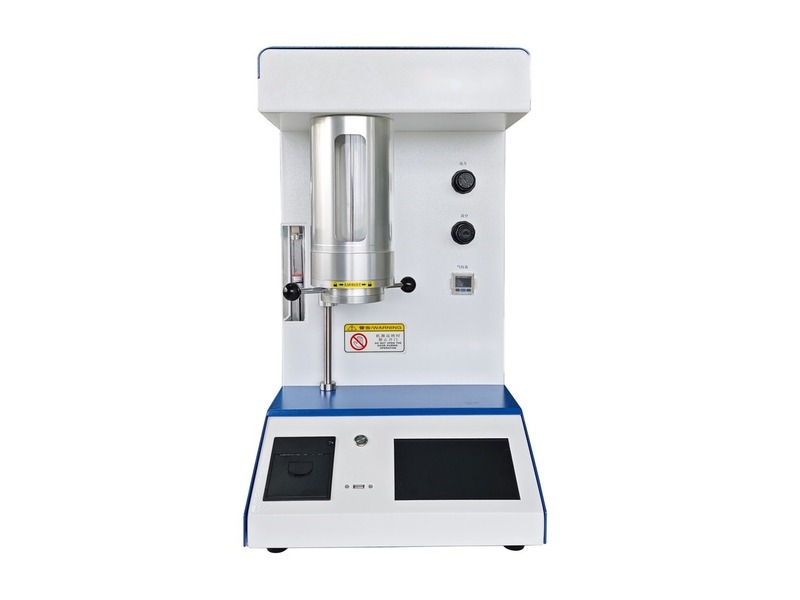
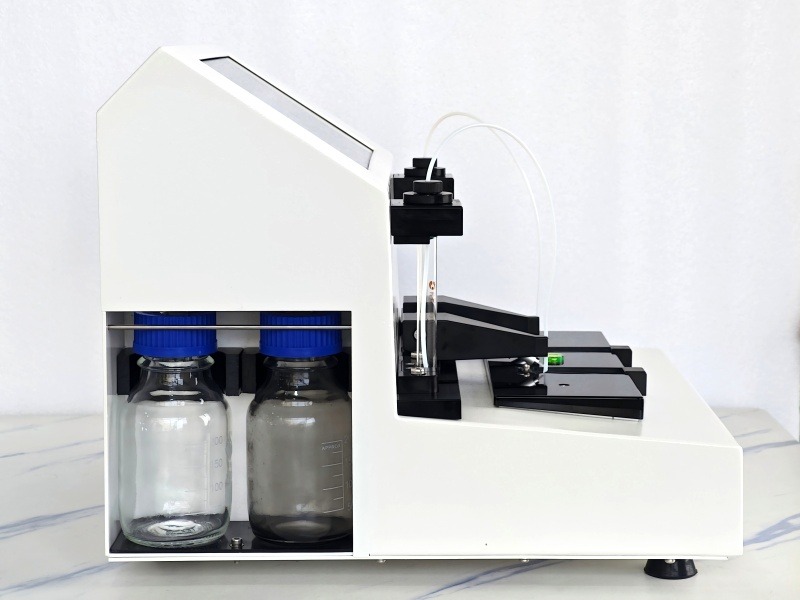
In fleet maintenance no single instrument reaches a verdict. They divide the work, each covering one stretch.
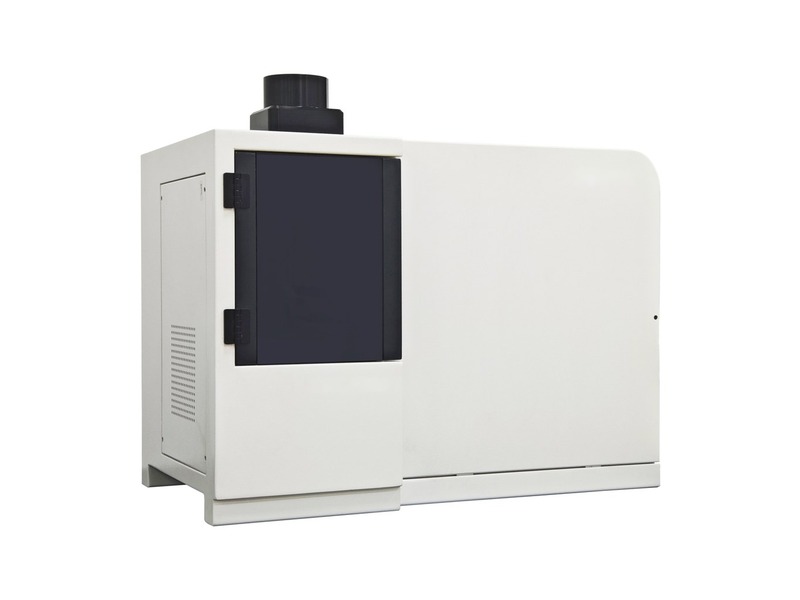
Elements come first. The sample is energised and read by its emission lines, returning wear metals, additives and contaminants in one pass. Iron, copper, chromium and lead show which friction pair is suffering; silicon is dust pulled in with the air; calcium, zinc, phosphorus and magnesium mark how much additive remains. Read the three groups as one set — taking a rising iron figure as wear on its own is how a normal additive drop-off gets mistaken for a fault.
Cleanliness comes next. A particle counter sorts particles into size bands and turns the counts into a contamination code: the higher the number, the dirtier the oil. It is quick, and its limit is equally clear — it says how much, never what. Inside a fleet programme it works as a screen.
Then morphology. Spectroscopy responds poorly to coarse debris and can miss it altogether. Ferrography pulls the debris out with a magnetic field and lays it on a slide, where a microscope or an imaging system reads the shapes: cutting curls, bright-edged spalling plates, sliding streaks. Each points somewhere different.
Finally the oil itself. Kinematic viscosity, water content and total base number decide whether the charge can stay in the sump. In the read sequence this group settles the keep-or-drain call.
| Function | The question it settles | What it hands back |
| Element spectroscopy | Where it wears, what came in, how much additive is left | Trends in wear metals, contaminants and additives |
| Particle counting | How much debris is suspended in the oil | Contamination code, higher is dirtier |
| Ferrography and morphology | What shape the debris takes | Cutting, spalling and sliding classified |
| Fluid property testing | Whether the charge is still usable | Viscosity, water and base number against limits |
How to Take a Sample in Fleet Maintenance
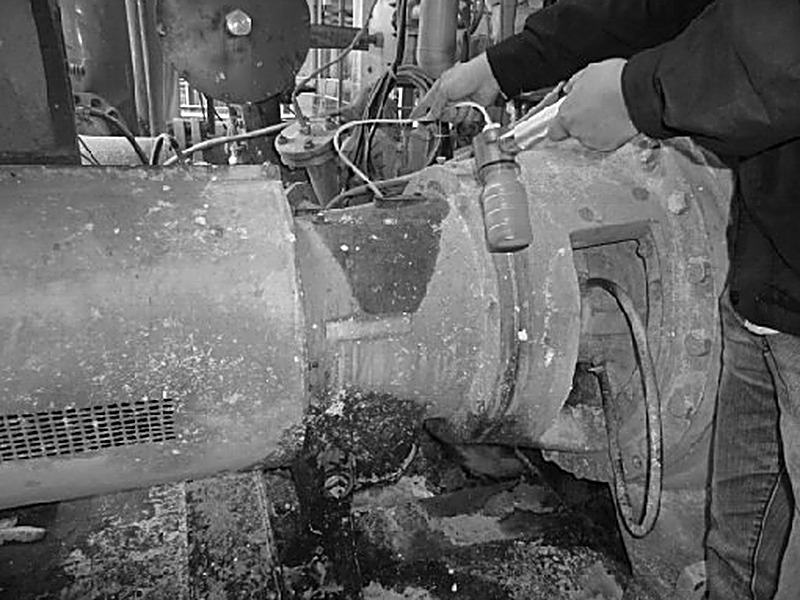
A clean bottle and a dedicated valve: a poor draw wastes every test that follows.
In fleet maintenance the sample is the foundation the whole dataset rests on, and the step most likely to go wrong. Most implausible results trace back to the draw, not the bench.
• Write the draw point into the work instruction. Engine oil comes from the dipstick tube or a dedicated valve; transmission and hydraulic circuits from the valve built into the system.
• Draw it warm. Sample once the oil is up to temperature and still circulating, and run a cold or long-parked vehicle for a while first.
• Keep bottle and line clean. Use a single-use clean bottle and purge the valve and line before filling.
• Note the duty. Record kilometres or engine hours, top-up volume and oil brand for the record.
Manual sampling and container preparation follow ASTM D4057, although its scope excludes hydraulic and insulating oils. On any one vehicle, the draw point and timing still come from the manufacturer's service schedule.
Which Indicators to Test for Fleet Maintenance
Every bottle eventually lands in the same table. The column most often ignored is the method basis: readings taken on different bases cannot be compared in size, and that is the easiest trap when dozens of vehicles are lined up side by side.
| Indicator | What it reflects | Method basis to keep consistent |
| Iron, copper, aluminium, chromium, lead, tin | Wear intensity at each friction pair | Atomic emission, rotating disc electrode or plasma |
| Silicon, sodium, potassium, boron | Outside dust, coolant ingress | Run with the element panel; read sodium, potassium and boron together |
| Calcium, magnesium, zinc, phosphorus | Additive system and depletion | Run with the element panel |
| Size-banded particle counts | Cleanliness level | Banded coding basis of the contamination standard |
| Total ferrous debris | Coarse iron the spectrometer cannot see | Ferrous debris quantification basis |
| Kinematic viscosity | Fuel dilution, or oxidation and thickening | Kinematic viscosity at 40 degrees Celsius |
| Water content | Coolant ingress, condensation | Karl Fischer method |
| Total base number | Neutralising capacity left | Potentiometric titration basis |
Diesel engine oil, gasoline engine oil and heavy-duty vehicle gear oil each have their own oil-change criteria. Those documents set a threshold for the drain, not a test method. A fleet spans all three, so check first that the tests you run match the ones the standard lists.
Four Clues in a Fleet Maintenance Oil Report
A report can run to dozens of figures. Sorted, they fall into four clues, each with a question to settle.
▍Element Spectroscopy: Who Is Wearing
Element spectroscopy returns wear metals, additives and contaminants in one pass.
Spectroscopy burns the metals in the sample and identifies each element and its concentration from the emission lines. One result on its own tells you little; line several results from the same vehicle up together and you can tell a climbing wear metal from an additive. Iron and chromium moving up in step usually means liners and piston rings; copper, lead and tin becoming active usually means bearings.
▍Particle Counting: How Dirty Is the Oil
Particle counting bins debris by size and turns the counts into a code.
The output is a code, not a weight or a count you can picture. Sample before and after a drain and that code tells you whether the change was carried out properly. It is normally the first alarm to sound.
▍Ferrography: What the Debris Looks Like
Ferrography lays debris on a slide so its shape can be read.
Ferrography draws the debris onto a slide with a magnetic field, and microscopy or automated imaging reads the shapes. It translates "iron is rising" into a specific damage type, and cutting, spalling and sliding call for very different responses — one may need only a shorter drain interval, the other a stop and an inspection.
▍Fluid Properties: Is the Oil Still Usable
Viscosity, water and base number settle the keep-or-drain call.
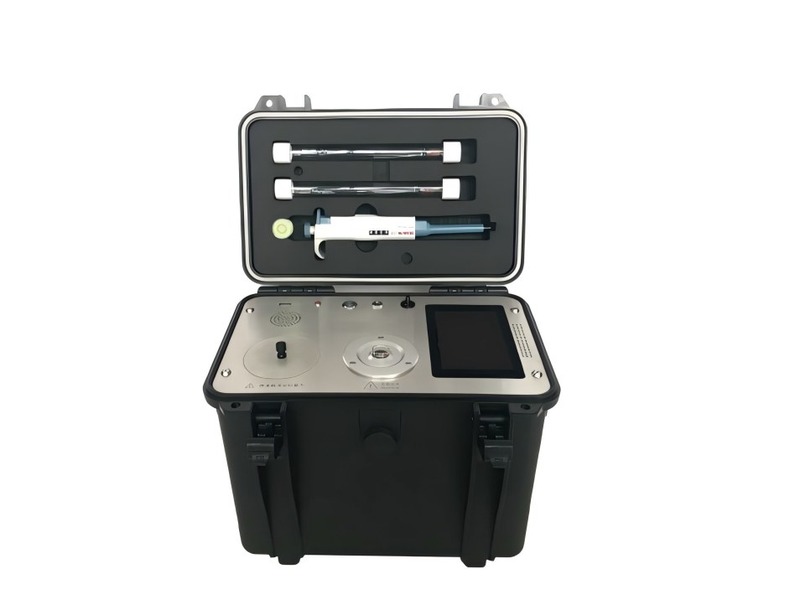
Viscosity shows which way the oil is drifting, water content shows how much has got in, and base number shows how much neutralising capacity remains. Built into portable form, these tests let you screen in the yard.
What Oil Analysis Can Find in Fleet Maintenance
In fleet maintenance unusual readings rarely appear alone. Use this table to work back from a number to a location.
| Reading | Where to look |
| Iron rising | Liners, piston rings, gears and other ferrous parts |
| Copper, lead or tin rising | Bearings and bushes |
| Chromium rising | Plating or piston rings |
| Silicon rising | Ingested dust, or a failed air filter |
| Sodium, potassium and boron rising together | Coolant entering the oil circuit |
| Size-banded counts high | Cleanliness falling, often with coarse debris |
| Kinematic viscosity falling | Fuel dilution — check injection and combustion |
| Kinematic viscosity rising | Oxidation and thickening, or a mixed top-up |
| Water content rising | Condensation, coolant seepage or flushing residue |
| Total base number falling | Additives nearly spent |
| Ferrous debris rising | Coarse iron the spectrometer cannot see |
Judging Fleet Maintenance Trends
In day-to-day service one reading describes only the present. Put it back on that vehicle's own timeline and a direction appears — and in fleet maintenance the direction is what you decide on. The three walk-throughs below use illustrative figures.
▍Iron Rising Alone
(Illustrative) Across three intervals iron moves from 45 mg/kg to 78 and then 120 mg/kg, while copper, aluminium and chromium stay flat. Iron lifting on its own normally points to one friction pair wearing faster rather than the whole unit declining. Shorten the sampling interval and inspect that filter and magnetic drain plug.
▍Silicon and Aluminium Climbing Together
(Illustrative) Silicon rises from 8 mg/kg to 22 mg/kg and aluminium follows, with iron barely moving. Look at the intake first: a torn air filter, a leaking intake duct, or long service on dusty routes. Check the filtration system before you schedule a drain.
▍Viscosity Up, Base Number Down
(Illustrative) Kinematic viscosity sits about 15 percent above the previous result and total base number has dropped to roughly a third of its new-oil figure. The oil has oxidised and thickened and the additives are nearly spent, so running on costs more than draining. This is the most frequent of the three, and the response is the simplest: book the drain.
All three follow one approach — rule out the cheap explanation before you suspect the machine. Verify the sample and the record, compare against that vehicle's own history, and read the indicators as a group.
What It Does for Fleet Maintenance
Repeat this loop a few times and fleet maintenance stops being a stack of reports and becomes a scheduling tool.
• Drain dates follow the data. Healthy vehicles move back in the queue and fast-degrading ones move up, saving oil, labour and disposal fees.
• Repairs shift from firefighting to rostering. Faults surface while parts are still cheap to replace, and unplanned downtime moves into a planned service window.
• Parts and staff can be booked ahead. Knowing which vehicle needs work, and where, removes the scramble in procurement and rostering.
Fleet maintenance counts both vehicles and people by the unit, and one oil sample costs far less than one breakdown — which is why sampling discipline matters more here than any single instrument.
Fleet Maintenance FAQ
Q | How Often Should You Sample in Fleet Maintenance?
Start from the manufacturer's interval and sample more densely for the first few rounds so each vehicle's baseline takes hold. Then let the trend set the pace: stretch it while the curve is steady, tighten it when something moves. Once set, leave the interval alone — change it constantly and the trend breaks.
Q | How Many Samples Does Fleet Maintenance Need?
It depends on the question. Engine, transmission and hydraulics are three separate circuits and are normally sampled one by one. For a general read on the vehicle, start with a single fixed point.
Q | Can On-Site Testing Serve Fleet Maintenance?
Each covers its own stretch. The fluid properties can be run in the yard; element analysis and debris identification depend on equipment and experience, so a laboratory handles them more reliably.
Q | What Does Fleet Maintenance Oil Analysis Cost?
The bill follows the tests you order, not the vehicle. A routine bottle with the element panel, contamination code and three fluid properties costs a fraction of one recovery call-out; add ferrography only when a screen flags something.
Q | What If a Fleet Maintenance Result Looks Wrong?
Suspect the sample before the machine. Recheck the draw point, the bottle and the duty record, then draw the same circuit again — an outlier is more often a cold or contaminated bottle than a failing part. If the repeat agrees, read trend and debris shape.
Conclusion
Fleet maintenance oil analysis turns one bottle of oil into one evidence-based decision: a fixed draw point, four instrument groups each covering a stretch, data read back along the timeline, and an outcome that is drain, repair or watch. Oil testing instruments from Soohow Instrument are developed around this method.